ChartGPT is an AI-powered chart-making web tool that lets users create charts by either pasting a table/data or describing the numbers in natural language.
Instead of manually selecting data ranges, choosing chart types and formatting charts, users can tell ChartGPT what they want to visualize. The tool interprets the data, selects an appropriate chart when necessary, and generates a presentation-ready visualization.
It currently supports nine chart types, including bar, line, pie, donut, stacked bar, grouped bar, area, scatter and horizontal bar charts. Charts can be exported as PNG, SVG or PDF, and users can also copy the underlying chart specification as JSON.
ChartGPT launched publicly in August 2026 and is based in Gurugram, Haryana, India. It was founded by Kanishk Mehra and is currently funded through customer revenue.
Deep dive
More about ChartGPT
ChartGPT Features
AI Chart Generation: Create charts automatically by describing what you need in natural language.
Data-to-Chart Conversion: Turn pasted numerical data or tables into visual charts quickly.
Natural-Language Prompts: Tell ChartGPT what you want to visualize using simple everyday language.
Automatic Chart Selection: Let AI choose a suitable chart type based on your data and request.
Multiple Chart Types: Create bar, line, pie, donut, stacked bar, grouped bar, area, scatter and horizontal bar charts.
PNG Export: Download charts as PNG images for presentations, documents and online content.
Do's
Do use it for quick chart creation: Turn raw numbers into visualizations without manually building charts.
Do use natural-language prompts: Describe the chart you want in simple language.
Do paste spreadsheet data: Use data copied from Excel, Google Sheets or other tabular sources.
Do specify the chart type: Mention bar, line, pie, scatter or another supported format when you have a preference.
Do use it for presentations: Create charts for pitch decks, business reviews, reports and presentations.
Do use it for business reporting: Visualize KPIs, revenue, sales, growth and other business metrics.
Don'ts
Don't use it as a spreadsheet replacement: ChartGPT is not designed to replace Excel or Google Sheets.
Don't use it as a BI platform: It is not a replacement for Power BI, Tableau or similar business-intelligence systems.
Don't expect live dashboards: ChartGPT is focused on creating individual charts rather than real-time interactive dashboards.
Don't expect live data connections: It does not currently function as a live database or spreadsheet synchronization platform.
Don't use it for advanced data analysis: Use dedicated statistical or analytics software for complex statistical modeling.
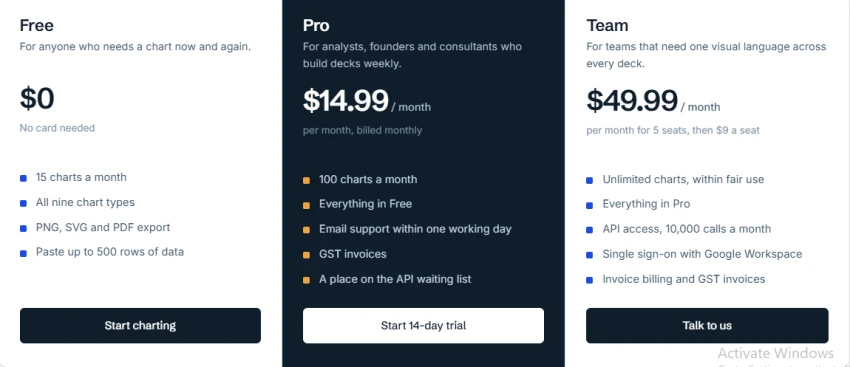
Pricing
Use Cases
Create charts for business presentations and reports.
Turn sales and revenue data into clear visualizations.
Create charts for investor and pitch decks.
Visualize company KPIs and performance metrics.
Convert marketing campaign data into presentation-ready charts.
Present survey and customer research results visually.
The verdict
Pros & cons
Pros
PNG, SVG and PDF exports are available on every plan without an account.
Switching chart type redraws existing data instantly without generating again.
The chart specification can be copied as JSON to rebuild elsewhere.
Cons
Chart colours and axis ranges are automatic and cannot be manually changed.
No chart history is kept, so unexported charts are lost when the tab closes.
★ Verified reviews
ChartGPT reviews
No reviews yet — be the first to share your experience.
No reviews yet
Be the first to share an honest, verified review of ChartGPT.